Graphing Trigonometric Functions & Their Transformations
Introduction
Once you understand the basic functions — sin θ, cos θ, tan θ, csc θ, sec θ, and cot θ — you can graph them and apply transformations to model more complex behaviour (e.g., periodic motion, waves).
Basic Shapes & Key Properties
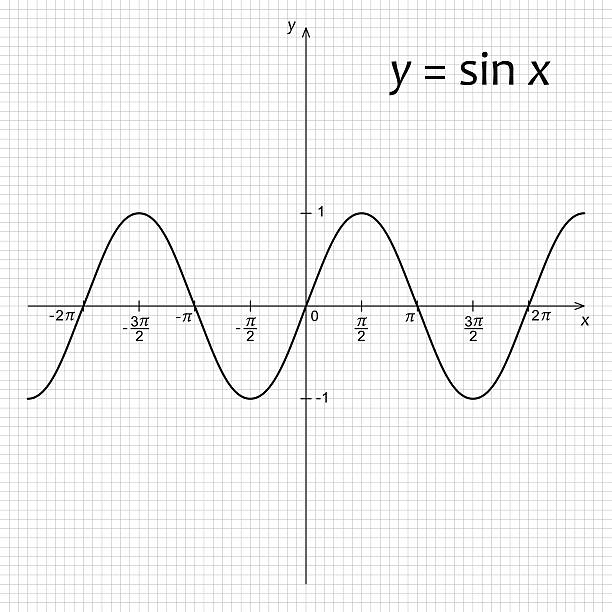
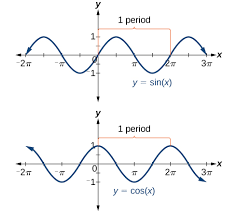
The sine wave (y = sin x) oscillates between −1 and +1, with a period of 2π.
The cosine wave is similar but starts at its maximum at x = 0.
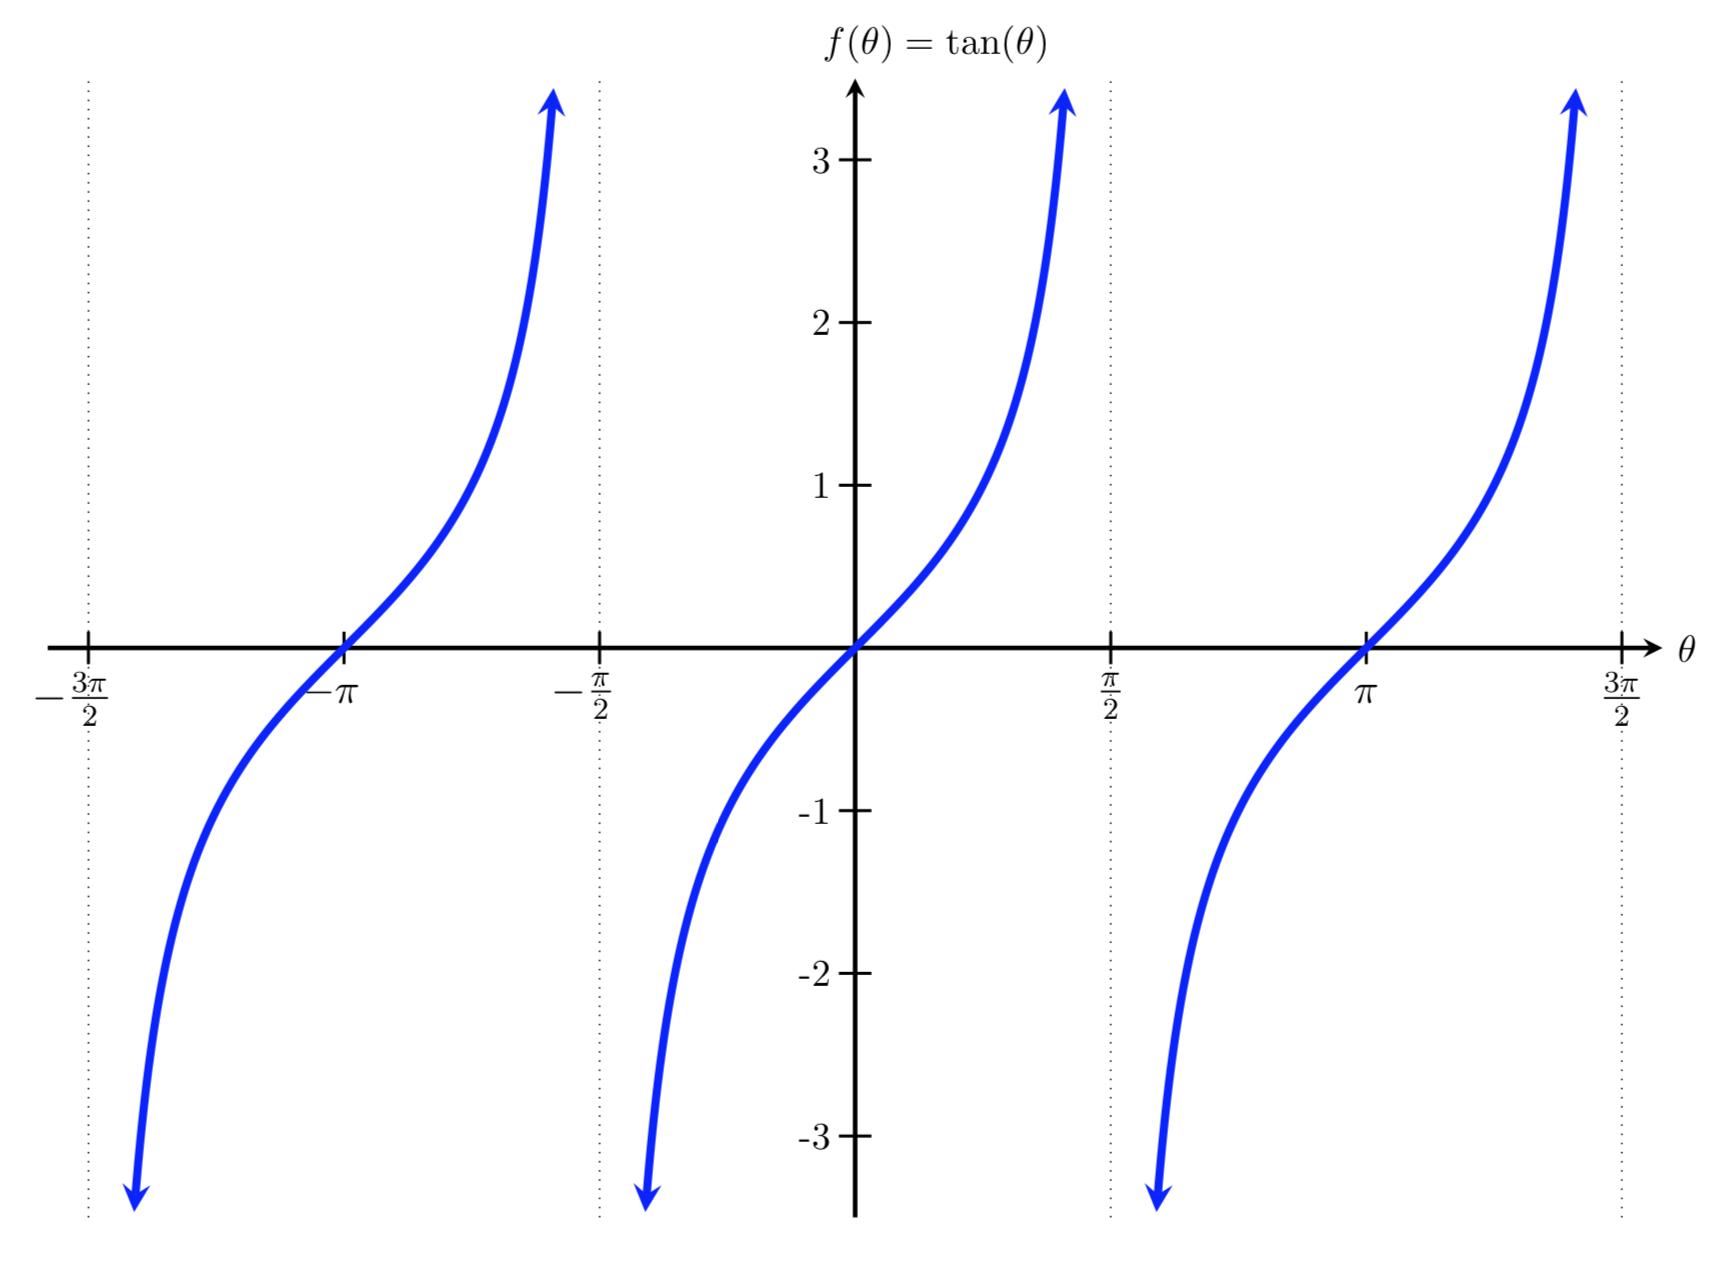
The tangent wave (y = tan x) has a period of π, and vertical asymptotes where cos x = 0.
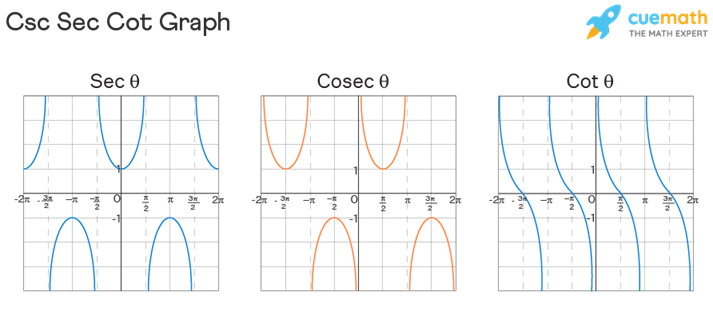
The reciprocal functions (csc, sec, cot) can be graphed by taking the reciprocal values of sine, cosine, tangent respectively — this often creates vertical asymptotes at zeros of the original functions.
Transformations: Amplitude, Period, Phase and Vertical Shift
A general transformed sine/cosine function can be written as:
y = A sin(Bx − C) + D
Amplitude = |A| → how “tall” the wave is.
Period = (regular period) ÷ |B| → for sine/cosine it’s 2π ÷ |B|, for tangent/cot it’s π ÷ |B|.
Phase shift = C ÷ B → the horizontal shift of the curve.
Vertical shift = D → the displacement up or down.
Example – Sine Function
If you have y = 3 sin(2x − π) + 1, then:
Amplitude = 3
Period = 2π ÷ 2 = π
Phase shift = π ÷ 2 = π/2 → shift right by π/2
Vertical shift = +1 → center line is y = 1
Graphing Steps
- Identify A, B, C, D from the function form.
- Determine the new period, amplitude, phase shift, and vertical shift.
- Sketch one full cycle using key points (for sine/cosine: start, quarter-period, half-period, 3-quarter, full).
- Apply vertical shift to all points.
- Mark asymptotes if graphing tangent/cotangent or their reciprocals.
- Repeat the cycle to show periodic nature.
Example Problem
Graph y = −2 cos((1/2)x + π/4) − 3
Amplitude = 2 (the “−” means reflection over x-axis)
B = 1/2 → Period = 2π ÷ (1/2) = 4π
Phase shift = C ÷ B = (π/4) ÷ (1/2) = π/2 → shift left by π/4
Vertical shift = −3 → center at y = −3
Sketch cos with amplitude 2, period 4π, shifted left by π/4, center line y = −3, then reflect and shift accordingly.
Summary
Graphing trigonometric functions becomes easier when you break down the problem into: base graph → identify transformations → apply them methodically. For sine and cosine you focus on amplitude, period, shift; for tangent and reciprocals you also watch for asymptotes and undefined points.